Start with a map
Connect the data to the buildings it relates to.
The 2D or 3D map provides an entry point to buildings and their information. It complements the dashboards rather than replacing them.
Lire cette étude de cas en français →
Case study / GridWatch · Energy monitoring platform
Making a platform tangible before presenting it to prospective customers.
GridWatch is a water and energy monitoring platform for cities and organisations. It brings together building consumption data to help teams spot anomalies, track spending and identify opportunities to reduce waste.
In 2023, following an initial scoping phase, I designed an interactive prototype in ten days to present the project to prospective customers and users. The client tested it, then used it as-is for presentations.
01 / Understanding the context
Initially called BRAIN, the project became GridWatch over time. It addressed a goal of the City of Albuquerque: monitoring water and energy use across its municipal facilities in real time to spot anomalies and reduce waste.
I worked at socraft for a company whose client was Albuquerque. The city was not my direct client: my assignment was to design a prototype for socraft’s client company.
Monitoring consumption across a building portfolio means bringing together different types of information: bills, meter readings, equipment details and historical consumption data.
More about the context: B.R.A.I.N. in Albuquerque and GridWatch.
02 / Defining the scope
Maps, bills, alerts, emissions, equipment and comparisons: the potential scope was broad. Not every feature was equally important for the first demonstration.
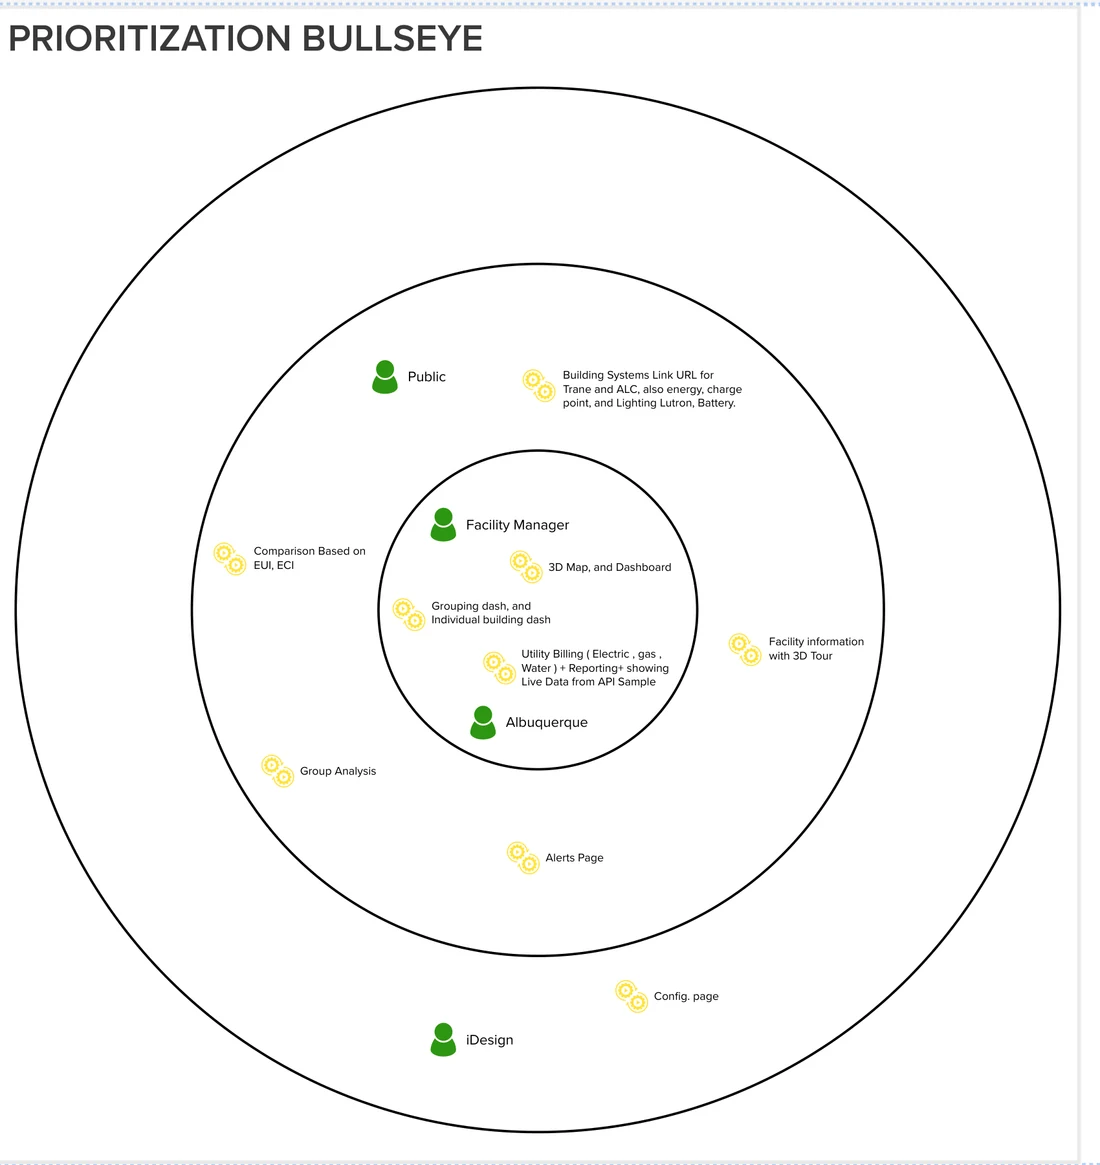
I used bullseye prioritisation: placing the most important needs at the centre, with the others in the outer rings. This gave us a visual way to discuss choices with the client.
03 / Structuring user journeys
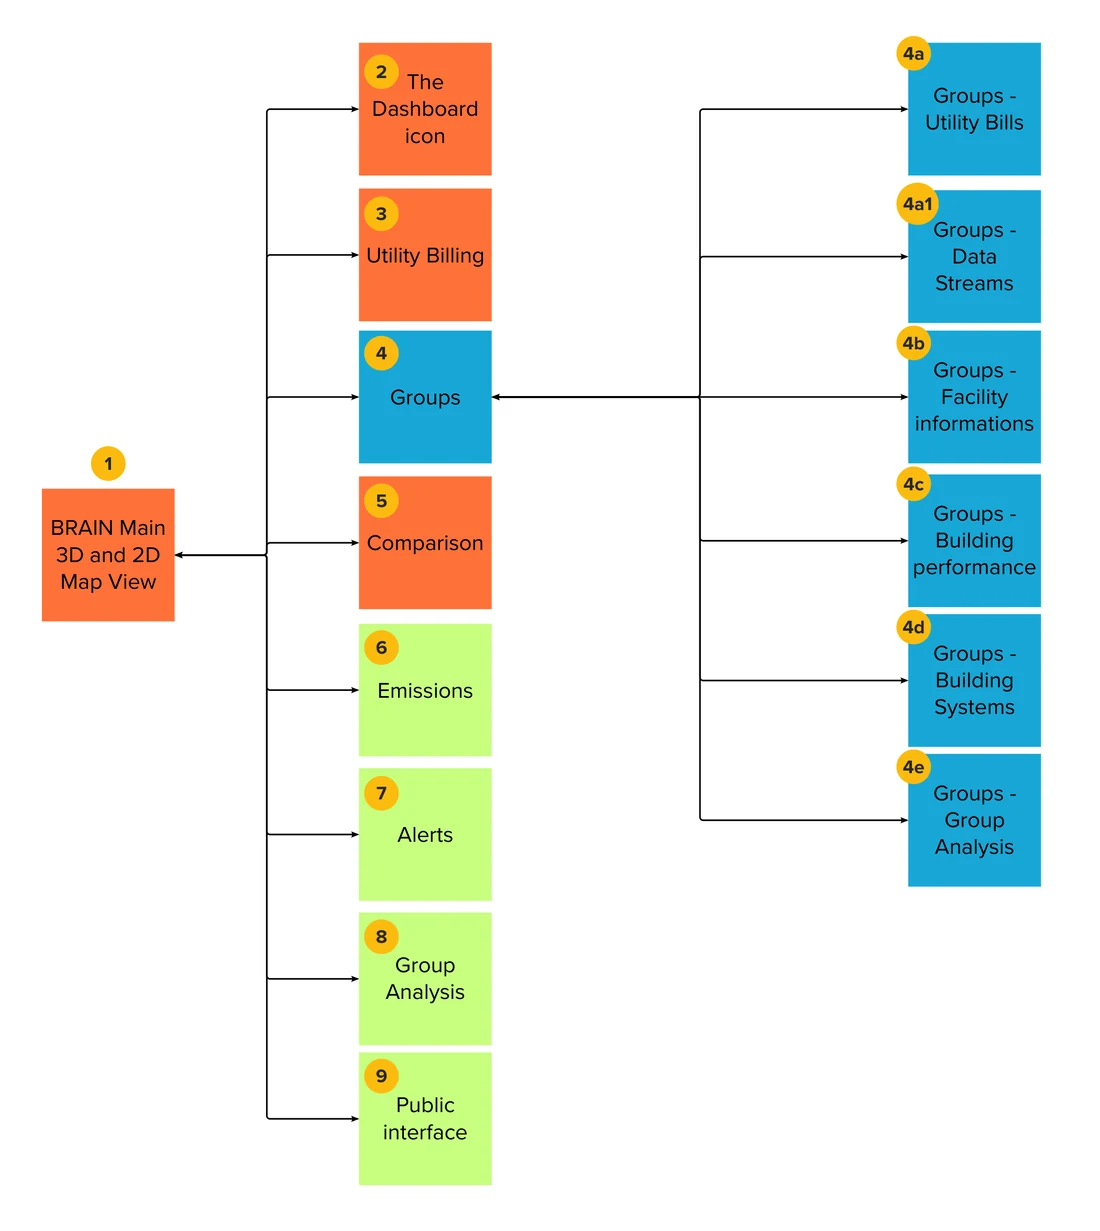
I broke down the main features, then mapped user flows to connect screens, actions and the information people would need.
This also highlighted questions to clarify: the scope of search, the distinction between historical and real-time data, and what users would compare.
Design decisions
The user flows gave the demonstration a structure: find your bearings, choose a scope, then examine the relevant information.
Connect the data to the buildings it relates to.
The 2D or 3D map provides an entry point to buildings and their information. It complements the dashboards rather than replacing them.
Move from an overview to a group or a single building.
The structure includes dashboards at different scales, allowing users to review a portfolio before exploring a more specific set of data.
Consumption and cost answer different questions.
The flows allow users to select an energy type, a period and a view. These choices organise access to the data before comparison or export.
The deliverable
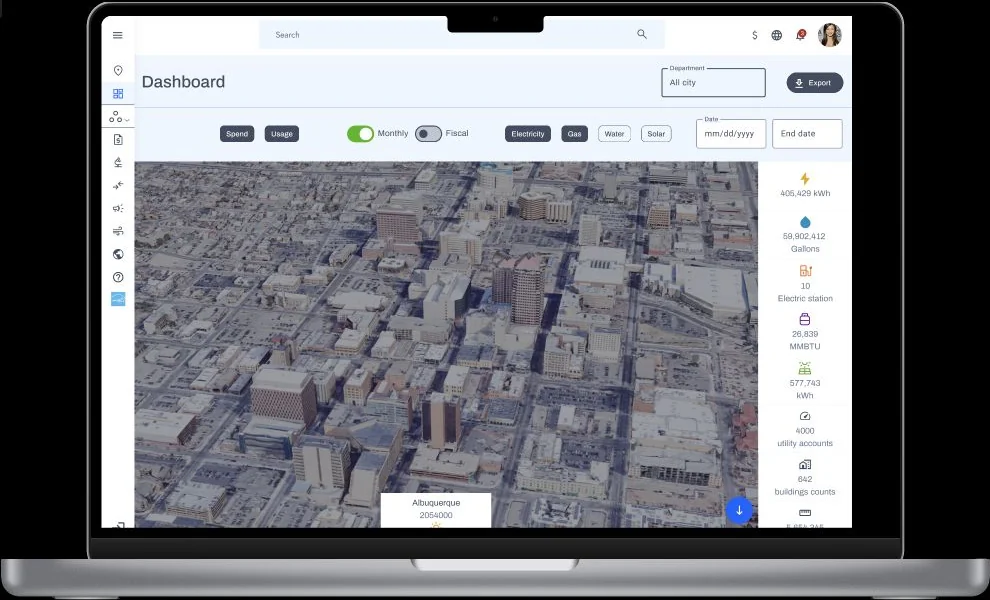
10 daysAfter the February scoping phase, I designed the complete interactive prototype in ten days. The client tested it, then used it as-is for presentations.
The result: a working presentation aid to demonstrate user journeys and explain GridWatch’s proposition to prospective customers and users.
Explore the prototype on Figma
The client tested the prototype for use in sales demonstrations. This was not usability testing with end users, nor a measurement of energy savings.
The prototype is hosted on Figma. Opening it may require access permission; it is not loaded automatically on this page.
04 / What came next
I continued as Product Designer and co-Product Owner. I helped prepare the backlog — the list of features and work to be completed —, clarify requirements and discuss them with developers.
We worked in English, including discussions with the technical director and CEO of the company where I was working.
What about your project?
I help you clarify priorities and design a prototype that makes your project tangible.